Use * syntax for faster search
Page History
| Section | |||||||||||||||||||||||||||
|---|---|---|---|---|---|---|---|---|---|---|---|---|---|---|---|---|---|---|---|---|---|---|---|---|---|---|---|
|
Overview
This page explains how to:
- Create a query, by building a query and running it
- Queries are highly customizable, and can contain user-created calculated fields. Queries can also be pivoted, filtered, and sorted.
- Create a visualization, by visualizing the results of a query
- Create a report or dashboard, by saving the results of a query
| Anchor | ||||
|---|---|---|---|---|
|
A query is a request for information, and building a query determines what type of information is actually requested.
Add a Field toa Query
Adding one or more fields to a query is the first step of building a query. Then, query fields can optionally be filtered, pivoted, or sorted.
| Anchor | ||||
|---|---|---|---|---|
|

To add a field to a query, do the following:
- Navigate to the Analytics page.
In the Field Selection, click the name of a field once to add it to the query. Clicking the field a second time removes the field from the query.
The
selectedadded field appears in two places:
- In the Data section as a column. Dimensions appear as blue columns and measures appear as orange-brown columns.
- In the In Use tab of the Field Selection. Dimensions appear as blue rows and measures appear as orange-brown rows.
Optional: Remove a Field from a Query
To remove a field from a query, do one of the following:
- In the Field Selection, click the desired field.
- In the Data section, click the gear icon in the column header of the desired field. Then, select click Remove.
Optional: Filter a Query
Filters provide a way to select a particular subset of data. A query can have multiple filters, and any field can be a filter, even if the field is not part of the query results.
Add a Filter to a Query
Anchor Add-Calculated-Field Add-Calculated-Field
Optional: Add a Calculated Field to a Query
| Add-Calculated-Field | |
| Add-Calculated-Field |
| Include A Shared Block | ||||
|---|---|---|---|---|
|
| Info |
|---|
See also: |
To add a calculated field To add a filter to a query, do the following:
- If the field(s) that the calculated field will be derived are not already part of the query, add the field(s) to the query.
- In the Data section, click the Add calculation button (see Analytics Page UI Elements, item 4).
- In the Create table calculation window, do the following:
- In the Expression field, enter the formula for how the calculated field should be derived. Calculated fields can be derived using basic mathematical operators—addition (+), subtraction (-), multiplication (*), division (/)—or built-in formulas.
For Format, select the desired format option: Default formatting, ID, Decimals, U.S. Dollars, British Pounds, Euros, Percent, or Custom. For more information, see Calculated Field Format Options.
- For Name, enter a name for the calculated field.
- Optional: Click Add description and enter a description (up to 255 characters) for the calculated field. The text that is entered in the Description field is visible when the Info icon is clicked. The Info icon appears when hovering over the calculated field in the Field Selection.
- Click the Save button.
- In the Expression field, enter the formula for how the calculated field should be derived. Calculated fields can be derived using basic mathematical operators—addition (+), subtraction (-), multiplication (*), division (/)—or built-in formulas.
| Anchor | ||||
|---|---|---|---|---|
|
In the Field Selection, hover over the desired field. Then, click the Filter by field icon.
Click the Filters section to expand it, if it is not already expanded. Then, click the + Filter button and select a field.
In the Data section, click the gear icon in the column header of the desired field. Then, select Filter.
Remove a Filter from a Query
To remove a filter from a query, do one of the following:
In the Field Selection, click the active Filter by field icon on the right of the dimension.Optional: Pivot a Query
Pivoting a dimension can help make a data table with multiple dimensions easier to read, or provide a new perspective from which to look at results. When a dimension in a query is pivoted, each value in the dimension becomes a column in the resulting data table.
Only dimensions, and not measures, can be pivoted.

Pivot a Dimension in a Query
To pivot a dimension, do one of the following:
- In the Field Selection, hover over the desired field. Then, click the Pivot data icon on its right(see Field Selection Icons).
- In the Data section, click the gear icon in the column header of the pivoted field. Then, select click Pivot.
Unpivot a Dimension in a Query
To unpivot a dimension, do one of the following:
- In the Field Selection, click the active Pivot data icon on to the right of the field.
- In the Data section, click the gear icon in the column header of the pivoted field. Then, select click Unpivot.
Anchor Filter-Query Filter-Query
Optional: Filter a Query
| Filter-Query | |
| Filter-Query |
Filters provide a way to select a particular subset of data. A query can have multiple filters, and any field can be a filter, even if the field is not part of the query results.
Add a Filter to a Query
To add a filter to a query, do the following:
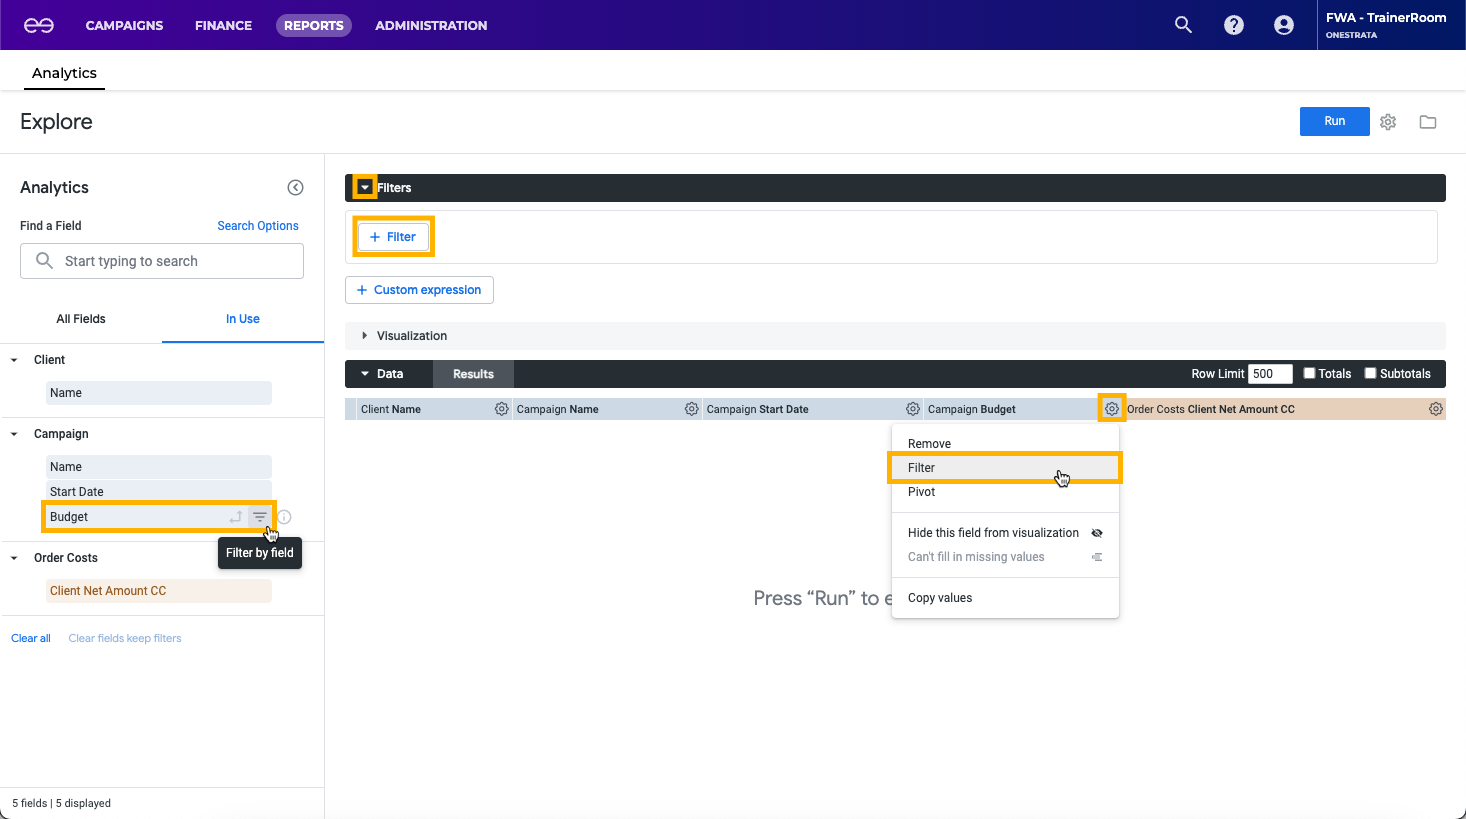
- Select a field to filter on by doing one of the following:
- In the Field Selection, hover over the desired field. Then, click the Filter by field icon (see Field Selection Icons).
- Click the Filters section to expand it, if it is not already expanded. Then, click the + Filter button and select a field.
- In the Data section, click the gear icon in the column header of the desired field. Then, click Filter.
- In the Field Selection, hover over the desired field. Then, click the Filter by field icon (see Field Selection Icons).
- Complete the filter options, which vary by the data type of the selected field. For example, a date field contains options such as within this date range, and a numeric field contains options such as is greater than this value.
Remove a Filter from a Query
To remove a filter from a query, do one of the following:
- In the Field Selection, click the active Filter by field icon to the right of the dimension.
- In the Filters section, click the X to the right of the filter.
| Anchor | ||||
|---|---|---|---|---|
|
By default, the results of a query are sorted according to the following hierarchy:
- By the first date dimension, descending
- If there is no date dimension: By the first measure, descending
- If there is no date dimension or measure: By the first dimensions, ascending
However, it is possible to customize how a query is sorted.
Sort By a Single Field
A sorted field contains an arrow in the column header that indicates the sorting direction: pointed up for ascending order and pointed down for descending order.

To sort by a single field, do one of the following:
- In the Data section, click the column header of the desired field once to sort in descending order.
- In the Data section, click the column header of the desired field twice to sort in ascending order.
Sort By Multiple Fields
When sorting by multiple fields, the sorted fields contain a number in the column header to indicate the sorting order.

To sort by multiple fields, do the following in the Data section:
- Hold the Shift key.
- Select the desired column headers, in the desired order.
| Anchor | ||||
|---|---|---|---|---|
|
After a query is built, run the query to retrieve the requested information. Whenever a query is modified, like a new field is added or a filter is removed, re-run the query to refresh the retrieved results.

To run or re-run a query, click the Run button in the upper right corner of the screen.
| Anchor | ||||
|---|---|---|---|---|
|
By default, query results are returned as a data table, but a query's results can be visualized in a variety of ways.

To create a visualization, do the following:
- Build and run a query.
- Click the Visualization section to expand it, if it is not already expanded.
- Select the desired type of visualization. Options include Table, Column, Bar, Scatterplot, Line, Area, and Pie. For more visualization options, click the ... icon.
- Click Edit to modify the visualization as desired, for example to relabel an axis or change how a data series is displayed.
| Anchor | ||||
|---|---|---|---|---|
|
The results of a query can be shared immediately, without saving the query as a report or to a dashboard first.

To share a query, do the following:
- Build and run a query.
- Click the Explore actions gear icon in the upper right corner of the screen.
Select Then, click Send. - Choose one of the following options:
- To send the query as an email, follow steps 4 and 5 of Send a Report as an Email.
- To send the query to an Amazon S3 bucket, follow steps 4 and 5 of Send a Report to an Amazon S3 Bucket.
- To send the query as an email, follow steps 4 and 5 of Send a Report as an Email.
| Anchor | ||||
|---|---|---|---|---|
|

When saving a query, there are three options:
- Save a query as a report: Save the query and any customizations, such as visualization options or sorted fields, as a report
- Save a query as a new dashboard: Create a new dashboard and save the query as a query tile on the dashboard
- Save a query to an existing dashboard: Select an existing dashboard and save the query as a query tile on the dashboard
Save a Query as a Report

To save a query as a report, do the following:
- Build and run a query.
- Click the gear icon in the upper right corner of the screen, next to the Run button.
- Hover over Save..., then select click As a Look.
- In the Save Look window, do the following:
- For Title, enter a unique name for the report. If another report with the same name already exists, saving the current report will replace the previous report. Report names are case-insensitive.
- Optional: For Description, enter a description of the report.
- Select the folder to save the report in. Folder options depend on the user's access permissions.
- For Title, enter a unique name for the report. If another report with the same name already exists, saving the current report will replace the previous report. Report names are case-insensitive.
- Choose one of the following options:
- To save the report and return to the Analytics page, click Save.
- To save the report and view the report, click Save & View Look.
- To close the Save Look window without saving the report and return to the Analytics page, click the X at the upper right corner of the window.
- To save the report and return to the Analytics page, click Save.
Save a Query as a New Dashboard

To save a query as a new dashboard, do the following:
- Build and run a query.
- Click the gear icon in the upper right corner of the screen, next to the Run button.
- Hover over Save..., then select click As a new dashboard.
- In the Save as a new dashboard window, do the following:
- For Title, enter a unique name for the dashboard and query tile. If another dashboard with the same name already exists, the current dashboard cannot be saved. Dashboard names are case-insensitive.
- For Settings, select the folder to save the dashboard in. Folder options depend on the user's access permissions.
- Optional: For Filters, select query filters to use as dashboard-level filters.
- For Title, enter a unique name for the dashboard and query tile. If another dashboard with the same name already exists, the current dashboard cannot be saved. Dashboard names are case-insensitive.
- Choose one of the following options:
- To save the dashboard, click Save.
- To close the Save as a new dashboard window without saving the dashboard, click Cancel or click the X at the upper right corner of the window.
- To save the dashboard, click Save.
Save a Query to an Existing Dashboard

To save a query to an existing dashboard, do the following:
- Build and run a query.
- Click the gear icon in the upper right corner of the screen, next to the Run button.
- Hover over Save..., then select click To an existing dashboard.
- In the Add to a Dashboard in this folder window, do the following:
- For Title, enter a name for the new query tile.
- Select the folder that contains the desired dashboard.
- Select the dashboard to save the query tile to.
- For Title, enter a name for the new query tile.
- Choose one of the following options:
- To save the query as a tile in the selected dashboard, click Save to Dashboard.
- To create a new dashboard and save the query to that dashboard, click New Dashboard and enter a name for the new dashboard. In the Add to a Dashboard in this folder window, select the newly created dashboard and click Save to Dashboard.
- To close the Add to a Dashboard in this folder window without saving the query, click the X at the upper right corner of the window.
- To save the query as a tile in the selected dashboard, click Save to Dashboard.